Using R
Starting R
R has its own interactive REPL (Read-eval-print loop) and this is where many R users on Linux will start.
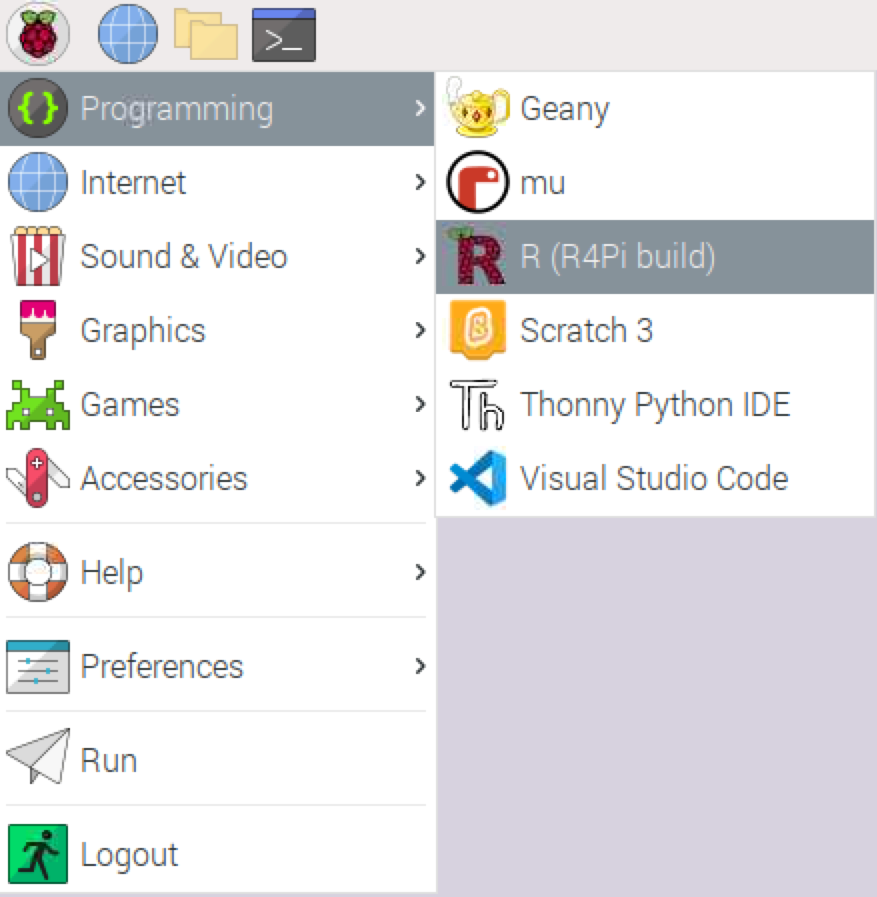
There are two ways to start R. If you're using the Raspberry Pi OS desktop, you can start R through the menu as shown below.
Alternatively, you can start an interactive R session via the terminal, by typing R at the command prompt.
sellorm@raspberrypi $ R

R version 4.0.4 (2021-02-15) -- "Lost Library Book"
Copyright (C) 2021 The R Foundation for Statistical Computing
Platform: armv7l-unknown-linux-gnueabihf (32-bit)

R is free software and comes with ABSOLUTELY NO WARRANTY.
You are welcome to redistribute it under certain conditions.
Type 'license()' or 'licence()' for distribution details.

  Natural language support but running in an English locale

R is a collaborative project with many contributors.
Type 'contributors()' for more information and
'citation()' on how to cite R or R packages in publications.

Type 'demo()' for some demos, 'help()' for on-line help, or
'help.start()' for an HTML browser interface to help.
Type 'q()' to quit R.

>
R starts up with messages about the version and license and so on.
At this point you're running R and you can start to do all sorts of fun things.
Let's start with a couple of basics.
The basics
A quick note about conventions: Throughout this page you'll see R commands that you should type in prefaced by the
> symbol. This is R's default "prompt". You don't need to type that, just everything that follows it.
Let's try some maths. Type the following and hit 'return':
> 3192 / 76
Note: R, like most programming languages, uses / for division and * for multiplication.
R should output:
[1] 42
Don't worry too much about the [1] for now, that's just R's way of saying that it's the first result. As you'll learn
later, we can return many results at once and knowing which position things are in is more useful then.
Now let's try some text...
Let's assign a variable. A variable is a way of saving something for later. This could be a number or some text, or any one of a number of things.
> my_name <- "sellorm"
R will look like it's not done anything and return you straight to the > prompt. Assigning a variable is a silent
operation, so R doesn't bother to tell us anything when all goes according to plan.
You can see what value our variable has by typing its name and hitting return:
> my_name
This will output:
[1] "sellorm"
(There's that [1] again!)
Let's use our variable in another command. Try this:
> cat("Hello", my_name, "\n")
This one should print the following to the screen:
Hello sellorm
The cat command is R's built-in 'concatenate' function, but it's often used for outputting simple messages like this.
Hopefully the content of the command you ran makes sense -- joining the word "Hello" with the name you stored earlier -- but you may be wondering about the "\n" on the end. This tells R to print a "new line". Without it, the message would still be printed, but our prompt would directly follow the output.
Try it:
> cat("Hello", my_name)
Hello sellorm>
See how the prompt is now stuck on the end of the output? This isn't a problem, it just looks messy and makes it harder to see where you are.
Lastly (for now!), you can run a couple of R's built-in demos.
Try this one first:
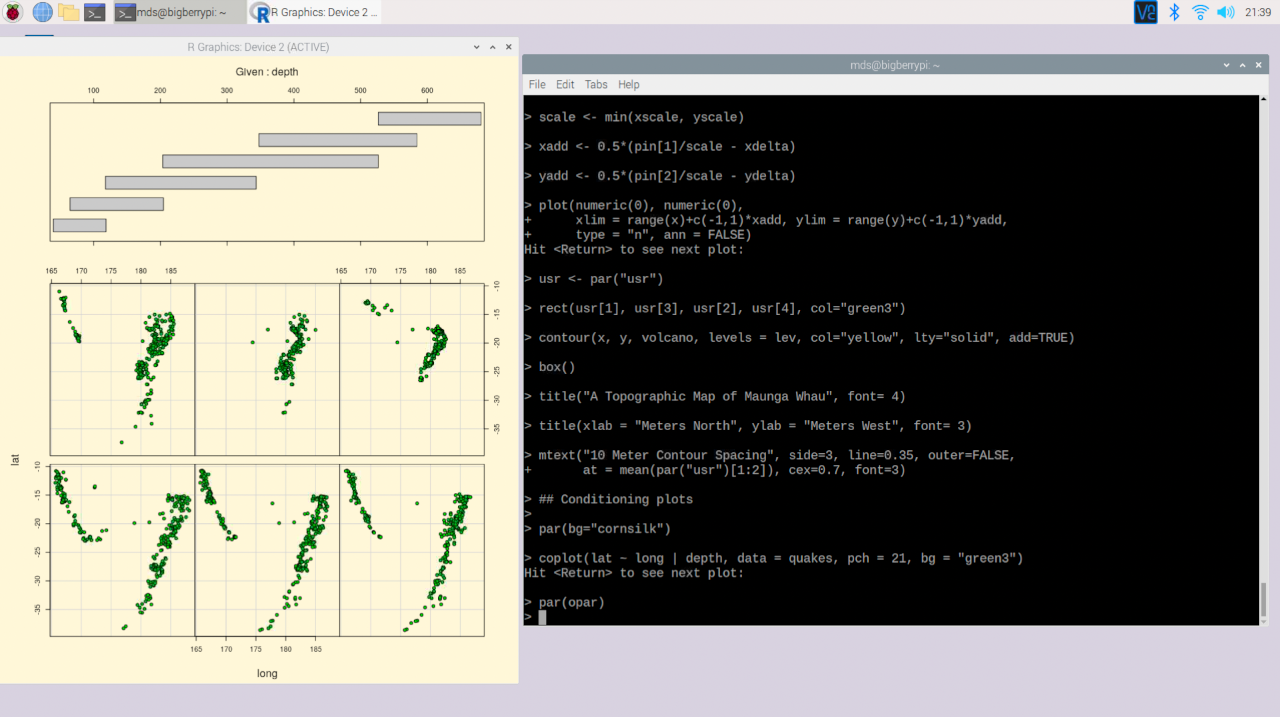
> demo(graphics)
This demo will open another window, and display some pre-canned plots created with the built-in plotting tools. R has a really powerful graphics system and the built-in plotting tools are great, however, if you want to take your plots to the next level check out the 'ggplot2' package.
To cycle through the demo plots, make sure the terminal window has focus and hit return.
When no more plots are displayed and you have a bunch of >s stacking up in the REPL, you know you reached the end of
the demo. You can close the graphics windows that opened now.
Next, try this one:
demo(image)
Again, press enter to see the next example. The code for each example is shown in the REPL too, so you can start to get a feel for how you might be able to start creating some plots of your own.
Now that you've played around a little in R, you can exit the REPL.
The official way to do this is with the quit() function, but R's developers have given us a handy alias, q(), to use
instead.
> q()
Save workspace image? [y/n/c]: n
When you run q(), R will ask if you want to save your "workspace". The workspace contains all the variables you've created
and packages that you've loaded. It's generally considered bad practice to save the workspace, as it can get us
into trouble later on, so always answer with "n".
Eventually, even this might feel like too much typing and someone will point out that you can accomplish the same thing by pressing "ctrl+d" twice, so feel free to do that instead if you prefer.